Townandaround.org.uk
December 2019
Behind the Statistics
What does the Wales Index of Multiple Deprivation say about Ruthin?
It’s understandable that headline writers concentrated on the most deprived communities in Wales,
upon the publication on November 27th of the 2019 Wales Index of Multiple Deprivation (WIMD)
figures. But what about the opposite end of the scale? The WIMD ranks 1,909 lower super output
community areas (LSOAs). Ruthin is divided into three.
Ruthin 3 broadly covers Parc
Brynhyfryd, Erw Goch, Dro Deg,
Maes Cantaba, Castle Park &
Llanrhydd. In 2019, it was
ranked as the 23rd least
deprived in Wales out of 1909.
This is an improvement over
60th place in 2014 and 34th in
2011. Ruthin 3 equated to the
6th least deprived area in North
Wales, out of 423, an
improvement over 2014 when
Ruthin 3 was 8th.
In 2019, Ruthin 3 was again the highest-ranking LSOA in Denbighshire out of 58. In 2019
Denbighshire, behind it came Denbigh Lower 1 (2nd in Denbighshire and 40th in Wales); Prestatyn
East 2 (3rd/146th); Denbigh Lower 2 (4th/180th); and Llanbedr DC/Llangynhafal (5th/303rd). The
ranking positions were identical in Denbighshire in 2019 to 2014.
Ruthin 2 broadly covers Bryn Eryl, Greenfield Road, Haulfryn, Central, Lon Parcŵr, Canol y Dre,
Glasdir and Bryn Goodman. Ruthin 2 was ranked 463rd in Wales, compared to 317th in 2014 and
228th in 2011. This nevertheless placed Ruthin 2 and 3 within the 2019 top quartile in Wales. Ruthin
2 was 12th in Denbighshire, slipping a little from 8th in 2014.
Ruthin 1 is comparable to Llanfwrog Urban (Cae Seren, Porth y Dre, Maes Hafod and Llawr y
Dyffryn, etc). In 2019, this was ranked as 869th in Wales, compared to 850th in 2014. In 2019,
Ruthin 1 was ranked 27th in Denbighshire. It could therefore be said that Ruthin 1 is typically
average in terms of both the country and the county.
The village areas within Ruthin’s hinterland scored as follows, with Llanbedr DC/Llangynhafal
already mentioned, above, at 303rd in Wales. Llanarmon yn Iâl/Llandegla was ranked 402nd in
Wales; Efenechtyd 576th; Llandyrnog 657th; Llanfair DC/Gwyddelwern 755th; and Llanrhaeadr yng
Nghinmeirch 787th. Two were in the top quartile. In 2014, all but two found themselves in that
division.
What, then, does all this say about Ruthin and its villages? Ruthin is relatively prosperous when
compared to Wales, North Wales and Denbighshire. But, some things have changed. Ruthin 3’s
relative position has improved but Ruthin 2’s has not. Ruthin 1 is about the same. In 2014, what
tended to let Ruthin down was its lack of access to services. In 2019, for Ruthin 3, this appears to
have improved markedly. The housing score in Ruthin 2 and 1 appears to have had more of an
influence this time. In 2014, Ruthin 3 was ranked 7th in Wales in terms of its physical
environment—in 2019, Ruthin 3 was relegated to 148th in terms of its environment, yet we are not
aware of any degradation.
It’s not surprising that Ruthin’s villages all scored very well in terms of their physical
environment and community safety but more poorly for access to services. Such is the trade-off
residents need to make when living in these communities. But a significant reason why there has
been a worsening of ranked positions is because of a consistent fall in the housing score.
Profiling Places
Meanwhile, the easy-to-use “profiling places” web tool launched this autumn, giving a view of Ruthin
as a whole. Here, we consider Ruthin against our nearest neighbour, Denbigh, other towns in
Denbighshire and near neighbour Mold.
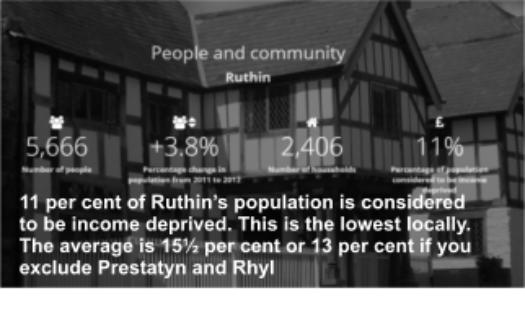
Between 2011 and 2017, Ruthin’s population grew quickly. Ruthin saw the highest change in
population, by 3.8 per cent, to 5,666. The average locally was just over one per cent. Denbigh’s
population fell by over one per cent, to 8,416. It seems that Ruthin and Denbigh’s populations are
converging.
Currently, Ruthin sees the lowest percentage locally of the working population on employment
benefit, at seven per cent. The average is 10 per cent. If you exclude Rhyl and Prestatyn, the
average is 8½ per cent. Denbigh’s percentage is 10.
68 per cent of Ruthin’s pupils achieved the level 2 threshold at GCSE key stage 4 including Welsh,
English and maths. Ruthin is bettered by scholars living in St Asaph and, just, Llangollen. The
average was 62 per cent. Denbigh’s percentage figure was 58.
If high car ownership is an indicator of wealth, 82 per cent of Ruthin’s households had access to a
private motor vehicle, equalled only by St Asaph. The average was 78 per cent.
Ruthin’s death rate was the lowest of any of the local towns, at 883 per 100,000 population. Mold’s
figure came very close but, otherwise, the average was 1,034 per 100,000. Denbigh’s was 1,080.
Ruthin is the safest town locally. It came top in five indicators and second in the sixth.
So, for example, the level of recorded burglary was 0.46 per 100 buildings, whereas the average
was 0.84. The figure for Denbigh was 1.05. In Ruthin, the rate of anti-social behaviour incidents per
100 population was 2.69. The average locally was 3.69 and Denbigh’s was 4.19. There were 1.04
recorded violent crimes in Ruthin per 100 residents compared locally to an average of 1.86.
Denbigh's figure was 1.78.